Organizational Learning and Growth


Organizational Learning and Growth |
|
|
NEW FOR VERSION 9.4 *Dashboard Reporting* Starting with the distribution of Version 9.0 in 2009 and continuing through to Version 9.3 released in 2012, Encompassing Visions’ ability to report on individual, team and organizational capabilities has been deepening. The software can now turn data into truly meaningful reports. These reports allow you to: understand the competency makeup of high performing teams; identify early-stage high performers; recognize and act on development needs at an individual, team or organization-wide level; diagnose the reason(s) for year over year changes in individual, team and organizational learning and growth; quantify the impact on team learning and growth through the staff recruiting, training, and termination processes; find the best Mentor/Mentee matches; determine how current technical and behavioral capabilities of staff match up against future organizational needs; and, implement the most effective way to maximize organizational learning and growth at minimal expense.
By using the analytical and diagnostic information now available, Management will be able to view and understand the organization like never before. They can view and monitor individual and team strengths and weaknesses, year over year.
Version 9.4 introduces two dashboard reports: Organizational Learning and Growth Dashboard and Employee Learning and Growth Dashboard. These reports require that Reporting Services be installed on the SQL server that houses your Encompassing Visions application. Your IT staff will be able to tell you whether you have access to this reporting.
As of Version 9.5.1, the reporting Services no longer needs to be installed on the SQL server that houses your |Encompassing Visions application.
Note: The Microsoft Report Viewer 2012 is now a component of the software. There is no separate installation by the client. Encompassing Visions no longer requires a SQL Server Reporting Services (SSRS) server for the Job Related Reports, the Dashboards, Competency Alignment Survey Results Report or the Succession Planning Report. It is in local mode, rather than remote mode, thereby eliminating the SSRS requirement. This simplifies the set up, configuration, and maintenance of an installation of Encompassing Visions. Features include increased speed, advanced paging and exporting capabilities. If assistance is required please contact techsupport@encv.com.
Click here to see Dashboard Reporting instructions in detail.
Organizational Learning and Growth reports This function draws on previous input about strategic and job-specific competencies and technical skills. It identifies strengths and development opportunities in the selected employee population. •Strengths are determined by the definition of strength for your Organization. Any evaluation at or above the definition of strength will be identified in the Strengths reports. (See the Policy: Employees > Employee Settings>Organization > What constitutes a strength in your organization for more information.) •Employees who excel in certain Competencies or Skills may be able to offer support or training in these strengths to others in the organization (mentor matching). •Development Opportunities for Competencies are those Competencies where the gap is the largest between the Evaluated Learning and Growth and the maximum possible Evaluation for that Competency. This calculation takes into consideration the importance of the competency in each Job, so the order of the Competencies displayed represents the order of the Competency's significance for improving Employee and Organizational learning and growth. •Development Opportunities for Skills are those skills where the evaluation is lower than the definition of strength for your organization. •Competencies or Skills that are identified as Development Opportunities can have targeted training plans established and monitored for effectiveness. •Knowing employee strengths will help determine whether the organization is building up the capability to support the achievement of short and longer term operational and strategic goals. •Knowing employee weaknesses or gaps helps to focus organization-wide training plans. It also enables your organization to measure the impact of training on competency and Technical Skill development. •The Technical Skills component of this analysis may be turned off for your organization if you do not do Technical Skills Evaluations.
Administrator Notes and Tips: •The definition of strength in your organization is identified in the Policy: Employees > Employees Settings >Organization> What constitutes a strength in this organization?. Strength is measured as a number between 7.5 and 10 (based on the 10 point scale) or 3.75 and 5 (based on the 5 point scale), and each level is defined in this module. •A meaningful analysis of competencies requires that a reasonably high number of competencies are identified. The number of competencies to be displayed is controlled by the Policy: Analysis>Analysis Settings > Competencies> Number of Behavioral Competencies in Organizational Learning and Growth Reports (1-38). The default is 10. oThe Policy: identifies how many of the Employee's most significant development opportunities to use in the analysis. Only those competencies identified in the learning and growth report as development opportunities are included in this function. To focus development efforts, the default is to identify the top 5. •The Policy: Analysis > Analysis Settings> Skills >Enable Skills Analysis 'Organizaional Performance' module? is used to turn on and off the review of Technical Skills. Note: whether the policy is set to yes or no, no data will be returned for any of the skills analysis if there are no Completed Learning and Growth reviews with skill evaluations. Also, skills will only be evaluated if Technical Skills are linked to the Jobs in the system. See Job Skills for more information about linking Skills to Jobs. •A meaningful analysis of Technical Skills requires a reasonably high number of skills to be used in the comparison. The number of skills to use is defined in the Policy: Analysis>Analysis Settings>Skills> Number of Tehnical Skills in Organizational Learning and Growth Reports (1-38). (the default is 38). This policy also determines how many skills are displayed in the Skill Strengths and Skill Development Opportunities screens.
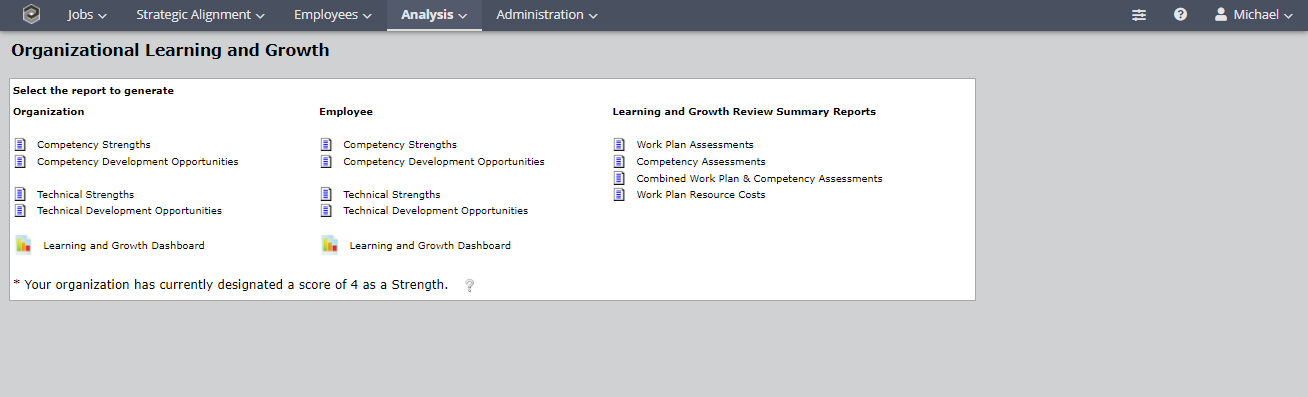
Viewing and printing Organizational Reports From the Main Menu move the mouse over Analysis in the navigation bar and click the Organizational Learning and Growth function:
The definition of Strength for your Organization is identified at the bottom of the page. Mouse over and click the tool tip The definition of strength in your organization is identified in the (Policy: Employees > Competency Reviews > What constitutes a strength in this organization?).
Note: Select your report first to open the filter options. The amount of data the system will need to sort through to return results will affect the length of time it takes to run these reports.
Organization
Employees
Learning and Growth Review Summary Reports
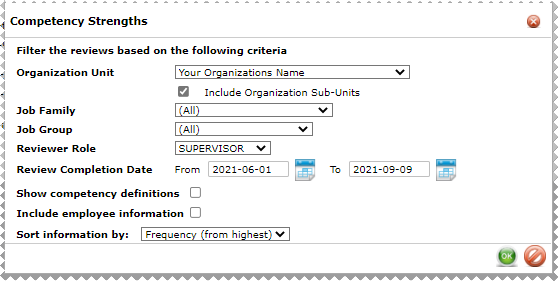
•Administrative Users can view the analysis for all Organization Units, or can filter by Organization Unit. •Leads and Supervisors can view the analysis for their own Organization unit and any sub-units. The system will automatically default to the highest Organization Unit the User has access to view. •Additionally, you can filter by Job Family, Job Group, Reviewer Role and Review Completion Date. •Review Completion Date is the Date the review was completed in the software, not the review period date or the due date.
Note: Future dates cannot be used for Review Completion Date filters. In addition, the 'To' Date must be on or after the 'From' Date.
Tip about dates: If only a 'To' Date is entered, all Reviews completed on or before that date will be included in the results. This criterion allows full historical reporting and will be too broad to review yearly progress. Changing both the 'From' and 'To' Dates to reflect one review year at a time will allow for year over year comparisons.
Note: The terms included here are the System default terms. If you have customized the application, your alternate terms for Job Family and Job Group will be displayed.
Report Definitions The following definitions apply to these reports: Competency Definitions: each competency definition is stored in the Administration module > Customize Terms and Weightings > Competencies. The definitions may have been customized for your application if you have done any competency re-mapping work. Evaluated Learning and Growth: on an Employee level, the evaluated learning and growth is simply that person's rating for the competency in question, averaged for all reviews completed during the selected date period of the report. On an organizational level, the evaluated learning and growth is the average of all active employees who have had reviews completed during the selected date period of the report. Learning and Growth Rating: The description corresponding to the evaluated learning and growth, points and point ranges. Learning and Growth Ratings are customizable at the organizational level. Frequency: The number of employees who exhibited this strength or development opportunity. Core Competencies: the knowledge and behaviours that will drive the achievement of your Organization's strategic goals. Gap: The difference between the employee's learning and growth rating and the maximum possible for the competency. It is based on completed, averaged reviews during the selected review period, and how important each Competency is in each Employee's Job. Required Proficiency: The level of proficiency in a Skill required to successfully complete a job. Required Proficiency can be identified as basic, intermediate, advanced or not required.
Notes about Required Proficiency: •When a skill is linked to a job, a Required Proficiency level can be identified for the skill in the job. •Because the same skill can be linked to many different jobs with different Required Proficiency levels, any analysis of skill strengths or development opportunities must treat Required Proficiency Levels separately with the skill, so the skill could appear up to three times as a strength or a development opportunity. This ensures that only skills of the same Required Proficiency are analyzed together and gives a more accurate picture of whether a skill is truly a strength or development opportunity, and what level of training/mentoring can or should be recommended.
This function is used to generate/print confidential reports regarding organization and training.
Five Organization level reports are available: 1.Competency Strengths 2.Competency Development Opportunities 3.Technical Strengths 4.Technical Development Opportunities 5.Learning and Growth Dashboard (see detailed instructions here)
Note: if your organization has elected not to use Technical Skills and the Policy: Analysis>Analysis Settings>Skills > Enable skills analysis is set to NO, the two Technical Reports will not appear.
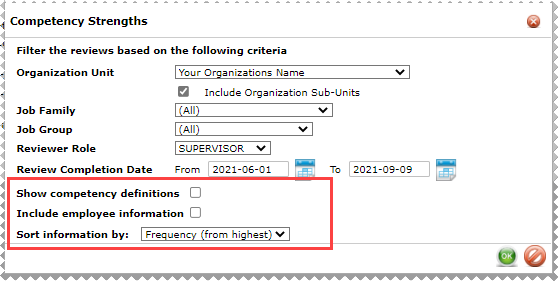
When a report is selected, the system will prompt for additional information:
•Show competency or technical skill definitions - If checked, the definitions for each Competency (as defined in Administration > Competencies) or Technical Skill will be included on the report. If unchecked, only the Competency or Technical Skill title will print. •Include employee information - If checked, the report will include employee names identified with that strength or development opportunity. •The employee information can be further filtered by selecting the Number of employees to show on the report. This restricts the length of the report by limiting the number of employees included based on their learning and growth scores. The options are: All, 5, 10, 25, 50, 100. •Sort information by Frequency, sorted from highest. •Frequency is the number of Employees who have this competency or skill evaluated as a strength or development opportunity.
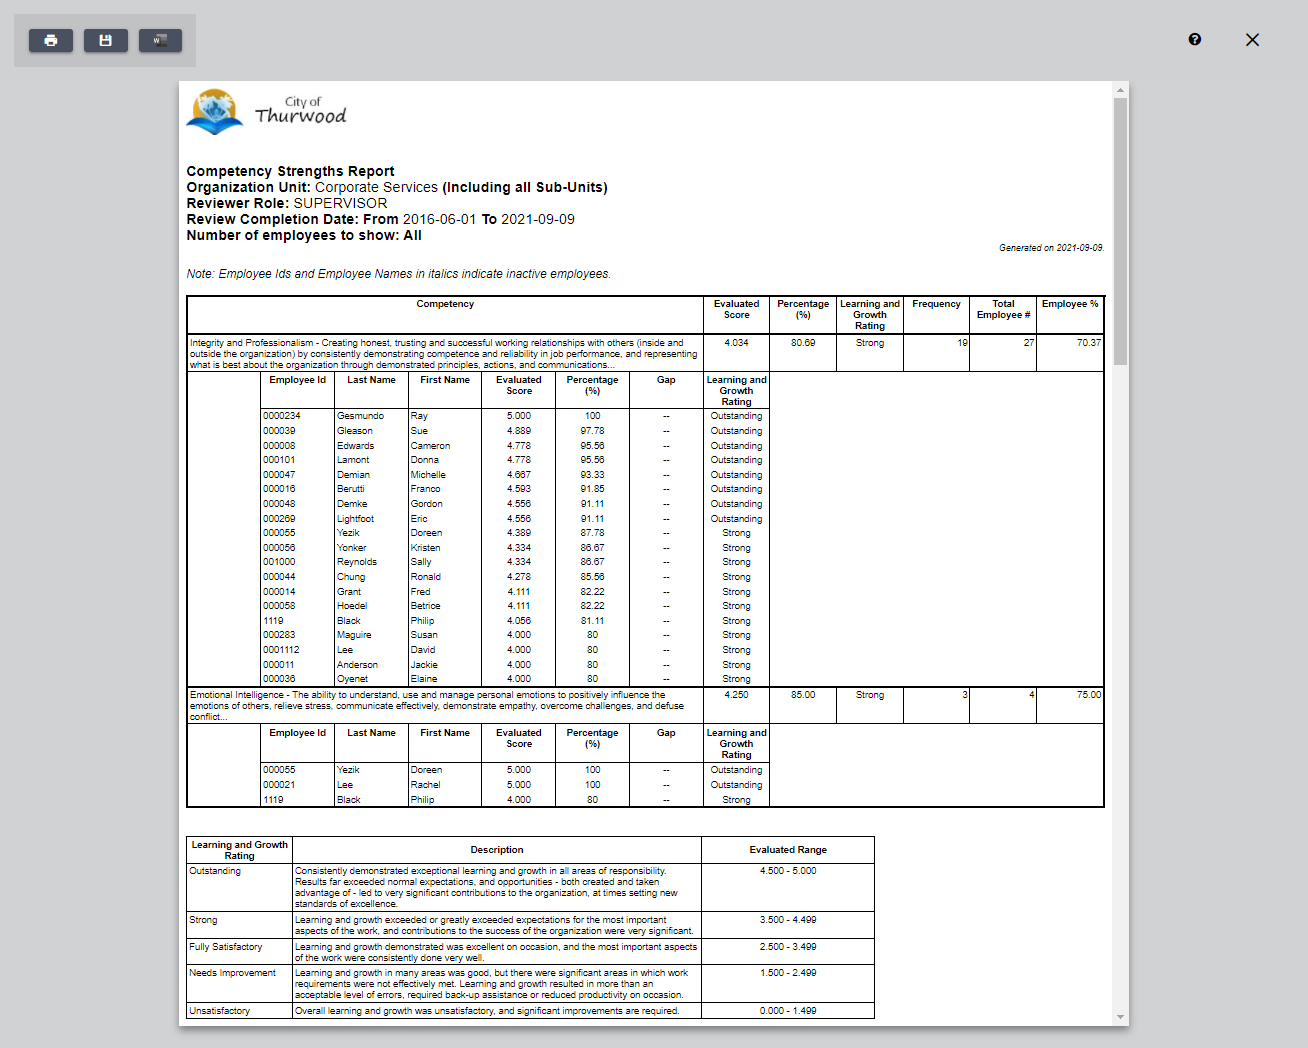
Sample report:
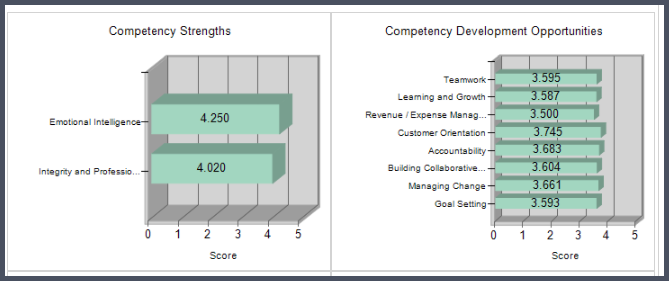
The Competency Strengths report shows those Competencies whose Strengths occur the most often in the selected Organizational Unit or for the selected Employees.
If the report is being filtered to include employee information, employees who best exhibit the identified strength will also be listed. The evaluated learning and growth rating for these employees is equal to or above the definition of strength for your organization.
Competency Development Opportunities The Competency Development Opportunities report shows those Competencies that exhibit the largest and most frequent gaps in the selected Organization Unit or for the selected Employees.
If the report is being filtered to include employee information, employees who show the greatest development opportunity will also be listed. Development Opportunity (or gap) is defined as the difference between the Evaluated Learning and Growth and the maximum possible Evaluation rating for that Competency, and whose evaluated learning and growth rating is less than the definition of strength for your organization.
Notes about Development Opportunities: •Development Opportunities are those competencies where the gap between the Evaluated Learning and Growth and the maximum possible evaluation is the greatest. •The maximum possible evaluation rating is based on the importance of each Competency in each Job assigned to Employees included in the selection. •The number of Development Opportunities to include in the analysis for each Employee is limited to the number that would be printed on the Employee Learning and Growth Report in the Identified Learning and Growth Enhancement Opportunities section. This helps prioritize the Development Opportunities for the Employee.
Note For Administrators: The Policy: Analysis> Analysis Settings>Competencies> Number of Behavioral Competencies in Organizational Learning and Growth Reports (1-38) determines how many of the Employee's top Development Opportunities to use in the analysis. .
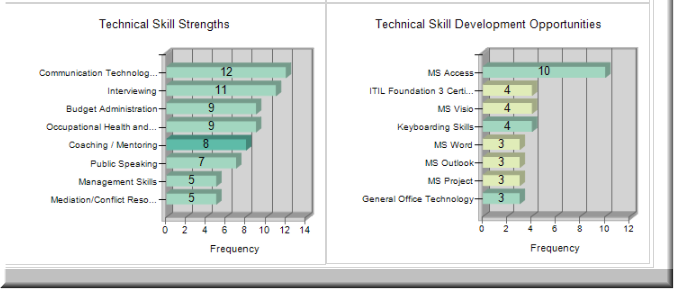
Technical Strengths (Organization level) The Technical Strengths report shows the Technical Skills whose Strengths occur the most often in the selected Organizational Unit or for the selected Employees. If the report is being filtered to include employee information, employees who best exhibit the strength will be listed. These will be employees whose evaluated learning and growth rating is equal to or above the definition of strength for your organization.
Technical Development Opportunities The Technical Development Opportunities report shows those Technical Skills that exhibit the largest and most frequent gaps in the selected Organization Unit or for the selected Employees.
If the report is being filtered to include employee information, employees who show the greatest development opportunity will be listed. These will be employees whose evaluated learning and growth rating is less than the definition of strength for your organization.
Employee Reports Five Employee level reports are available: 1.Competency Strengths 2.Competency Development Opportunities 3.Technical Strengths 4.Technical Development Opportunities 5.Learning and Growth Dashboard (see detailed instructions here)
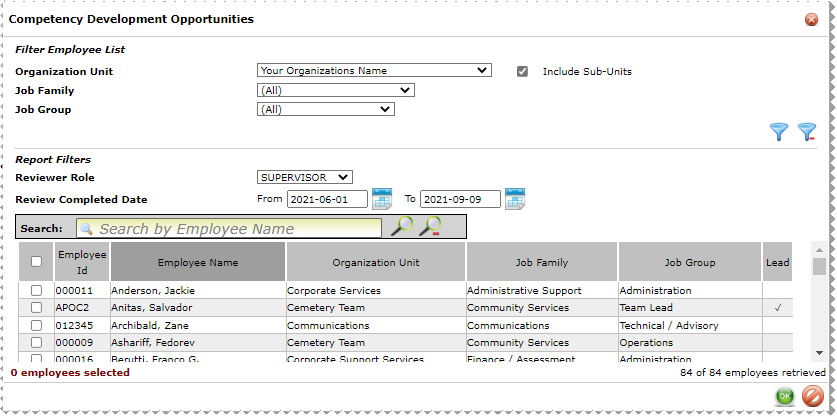
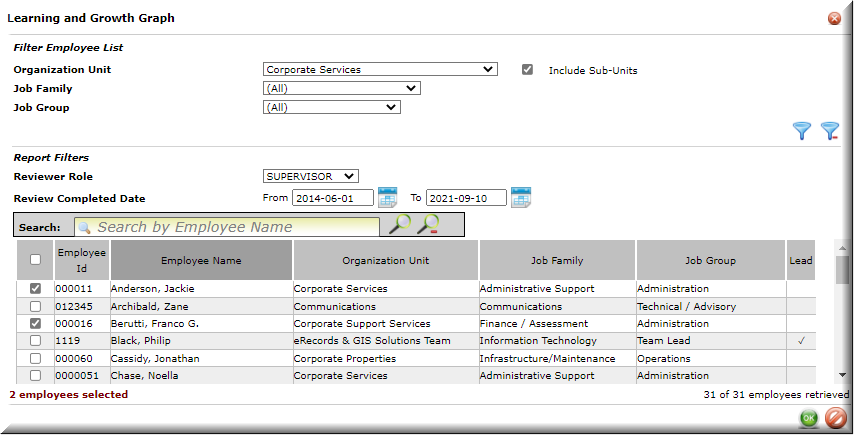
Note: if your organization has elected not to use Technical Skills and the policy: Analysis>Analysis Settings>Skills > Enable skills analysis is set to NO, the two Technical reports will not show. •Select the report. •Set the filter parameters. •The Employee List will populate within the filter parameters.
•Scroll to locate the Employee or Search by Employee name. •Administrative Users will see all employees included in the Organization Unit selected. •Leads can view employees belonging to their own Organization unit and any sub-units. The system will default to the highest Organization Unit the User has access to view.
Note: For confidentiality reasons, co-Lead names will not show on the list to other co-Leads, and the system will limit printing personal learning and growth review information to incumbent only.
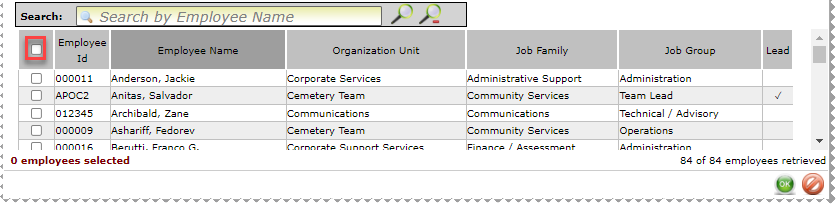
Select the employee or employees to include in the report.
Select each employee you want to include in the report, or check the selection box in the title to select all Employees in the Org Unit.
Depending on the report type selected, it will print the top strengths or development opportunities for the included employees. If there are no Competencies or Technical Skills that meet the criteria for the report, a message will indicate that fact.
Note: When an Employee becomes inactive, the Dashboard Data Cuts will not include the individual. But, the past departments numbers that included his/her review, still include his/her reviews.
Printing the Report All of the Organization Learning and Growth reports can be printed or saved.
To Print the reports: Select
To Save the reports: Select
There are two Dashboard reports available: Organization Learning and Growth Dashboard and Employee Learning and Growth Dashboard. The Organizational report compares the selected Unit's results with the Organization's results. The Employee Learning and Growth Dashboard includes the selected Employee's results and also compares the employee to both their Unit and the Organization where applicable.
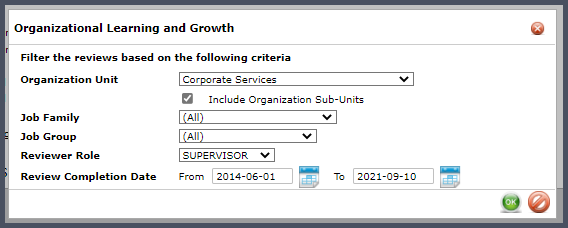
•Set the filter parameters.
•Select the Department Learning and Growth Summary Report to view (Organization-Learning and Growth Dashboard).
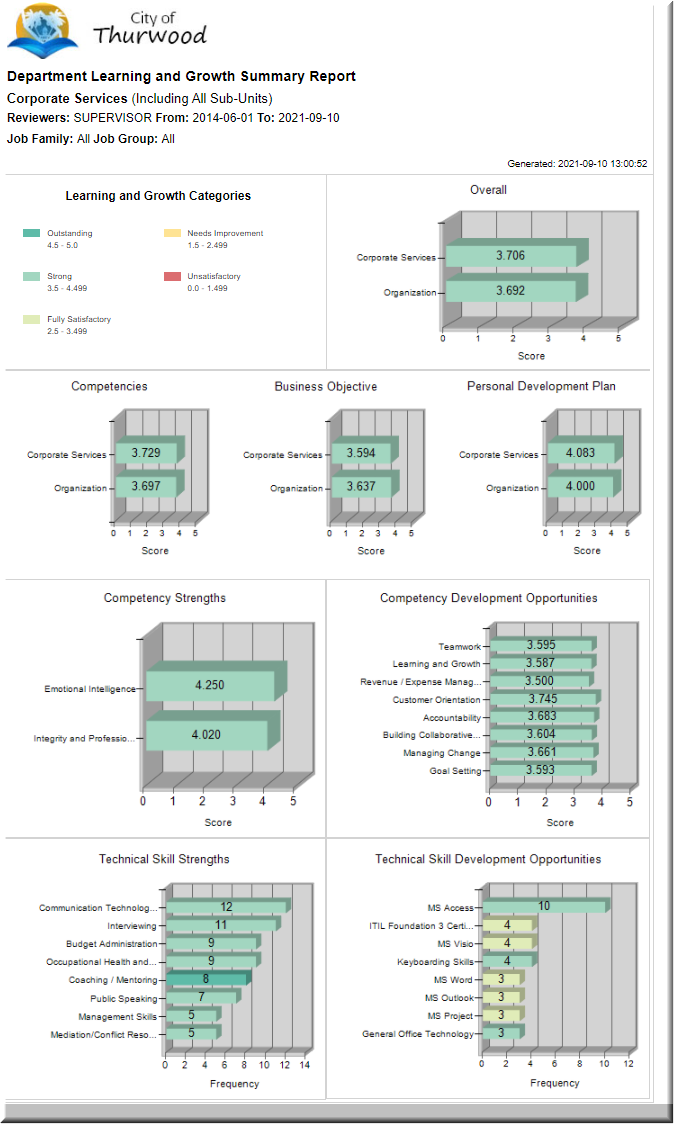
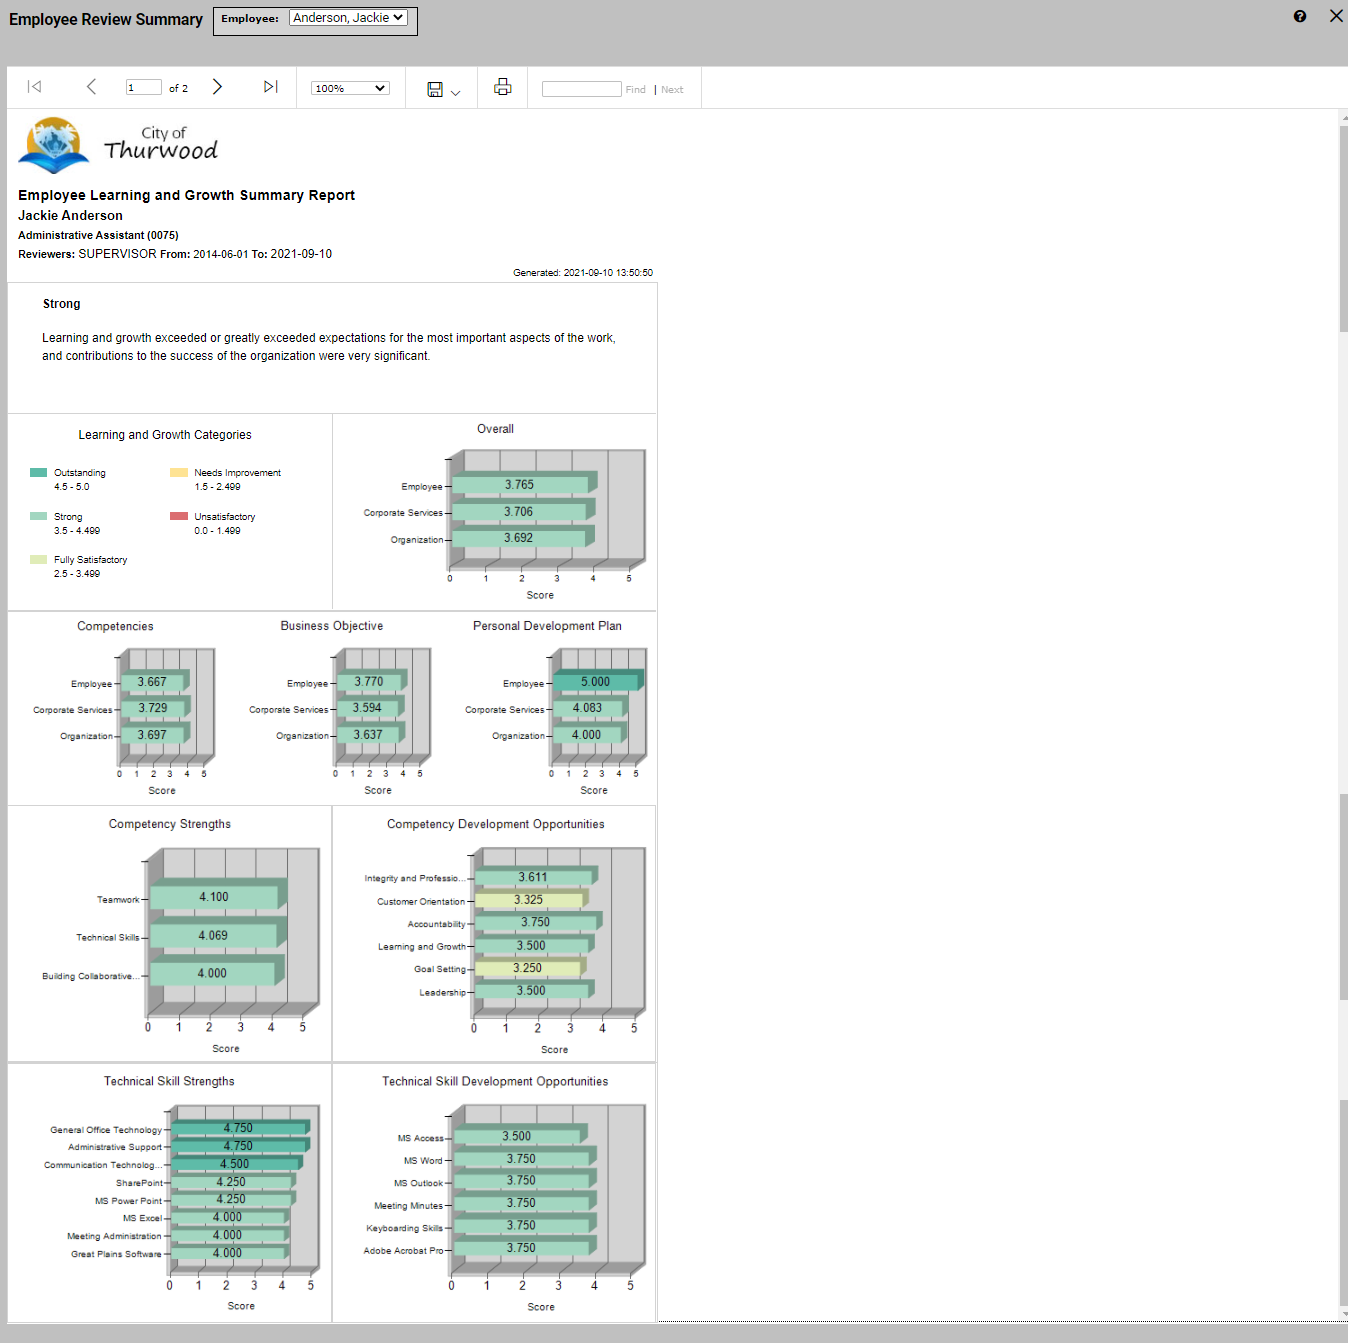
The first section of the report contains the following information from the Filter screen: Report name, Organization Unit, Reviewer type, Review Completion date range, Job Family and Job Group. •The legend reflects the Learning and Growth Ratings and, if these have been customized by your Organization, they may be different than pictured here. •The first graph compares the overall Rating for the Unit vs. the Organization. This graph is broken down into more detailed data in the remaining graphs.
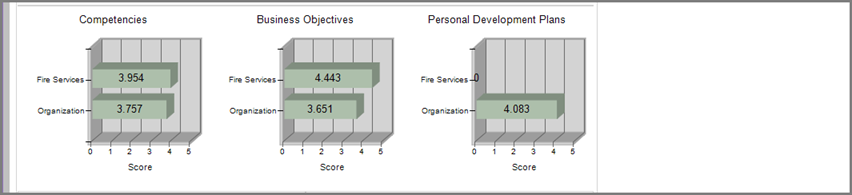
This section of graphs breaks the overall ratings into their component parts: Competencies, Business Objectives and Professional Development Objectives. Note: your Organization may have alternate terms for many of the terms in this report (e.g. Business Objectives, Job Family). Where there are alternate terms in place, those terms will be shown on these reports.
Next, the report moves into even more specific and valuable data. Based on the selected filters, these graphs show the Competencies that were performed at or above the organization's defined level of Strength or below that level for Development Opportunities. •The number of strengths and opportunities displayed are each limited to the top 8. •The color of the bar reflects the average evaluated learning and growth rating for each Competency. •The order in which the Competencies are listed in the Competency Development Opportunities graph is based on where training investment could have the most significant impact.
If Technical Skills are enabled for your organization, the final two graphs show the same information for those Skills:
Employee Learning and Growth Dashboard The Employee dashboard graphs include the individual's Learning and Growth Rating in the Overall and component reports, providing an accurate graphical comparison between the Employee, their Team and the Organization as a whole. •Strength and Development Opportunities reports are specific to the employee.
Note: when multiple employees are selected in the Employee List, the Employee reports will generate separately. Select the Employee you wish to view by locating their name in the pick list and clicking View Report.
Sample report:
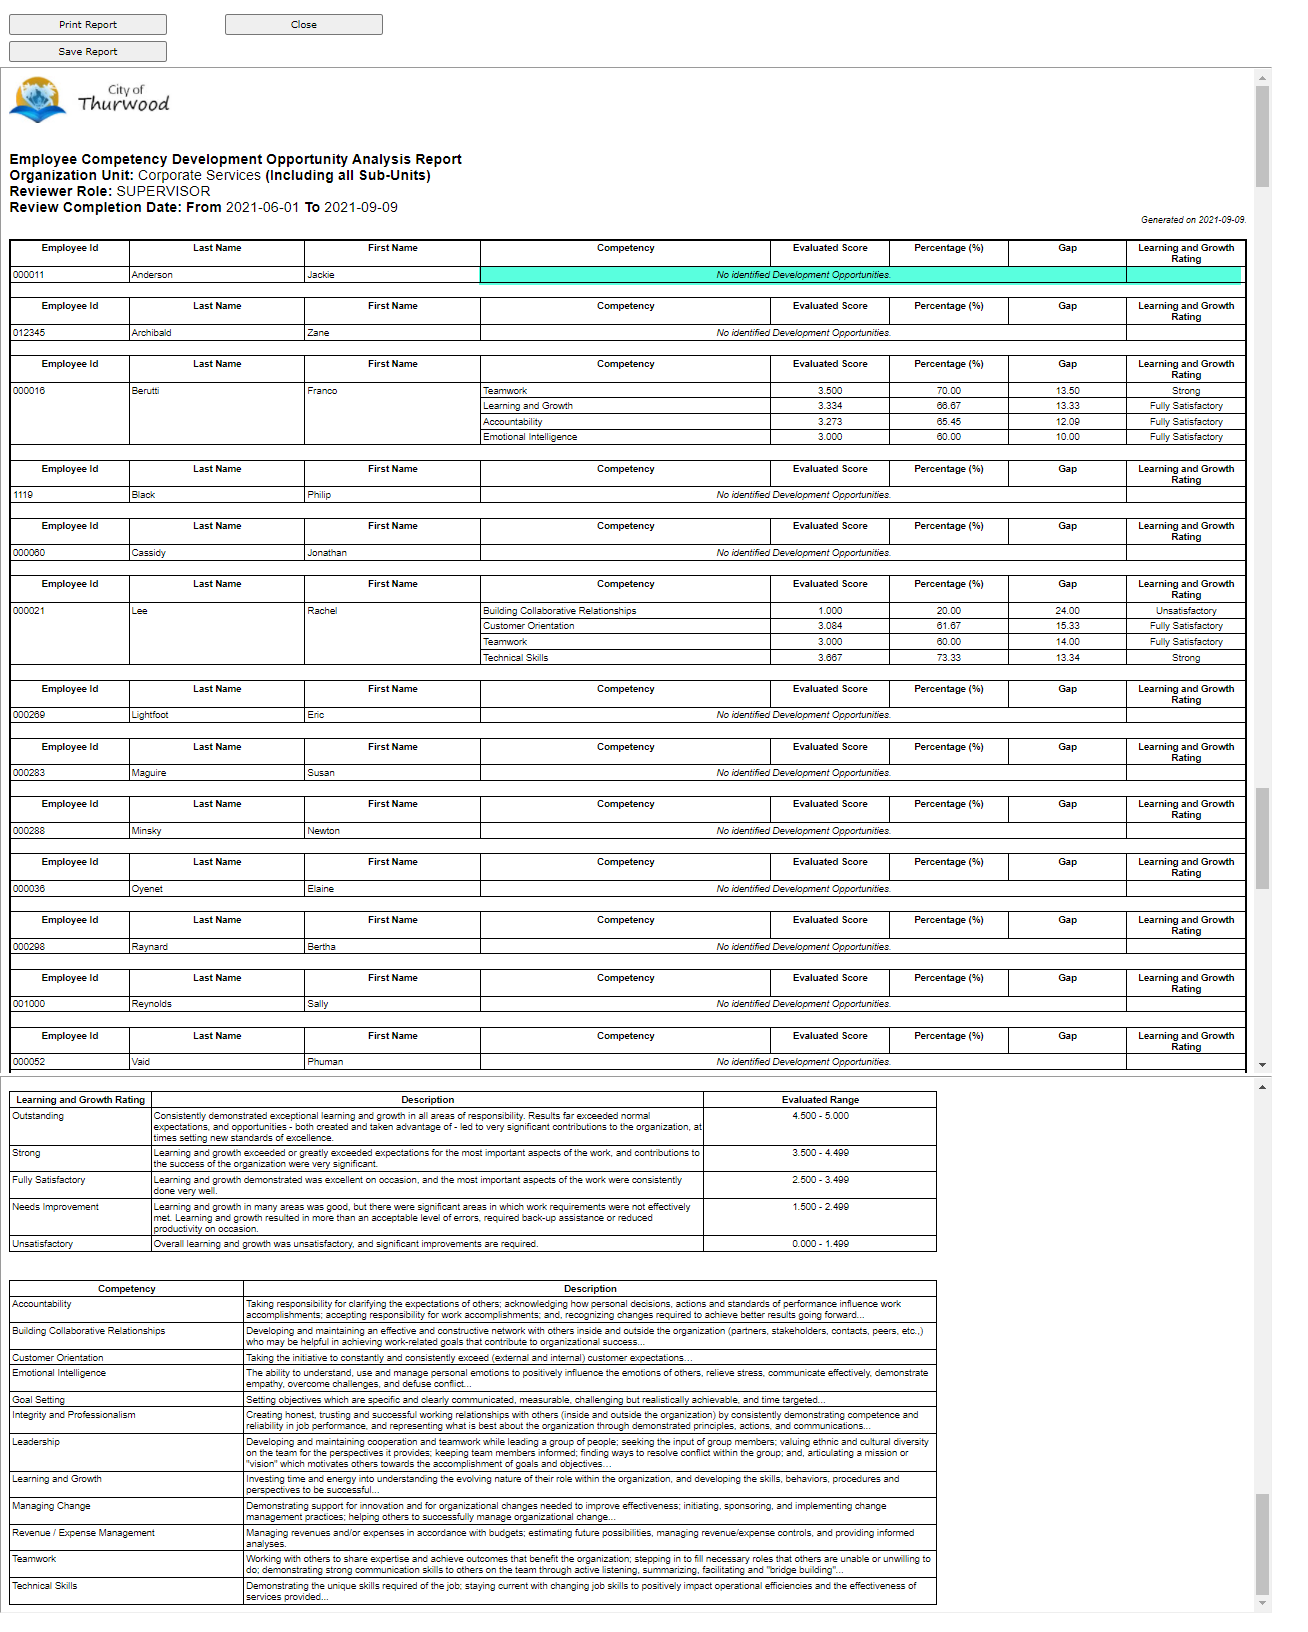
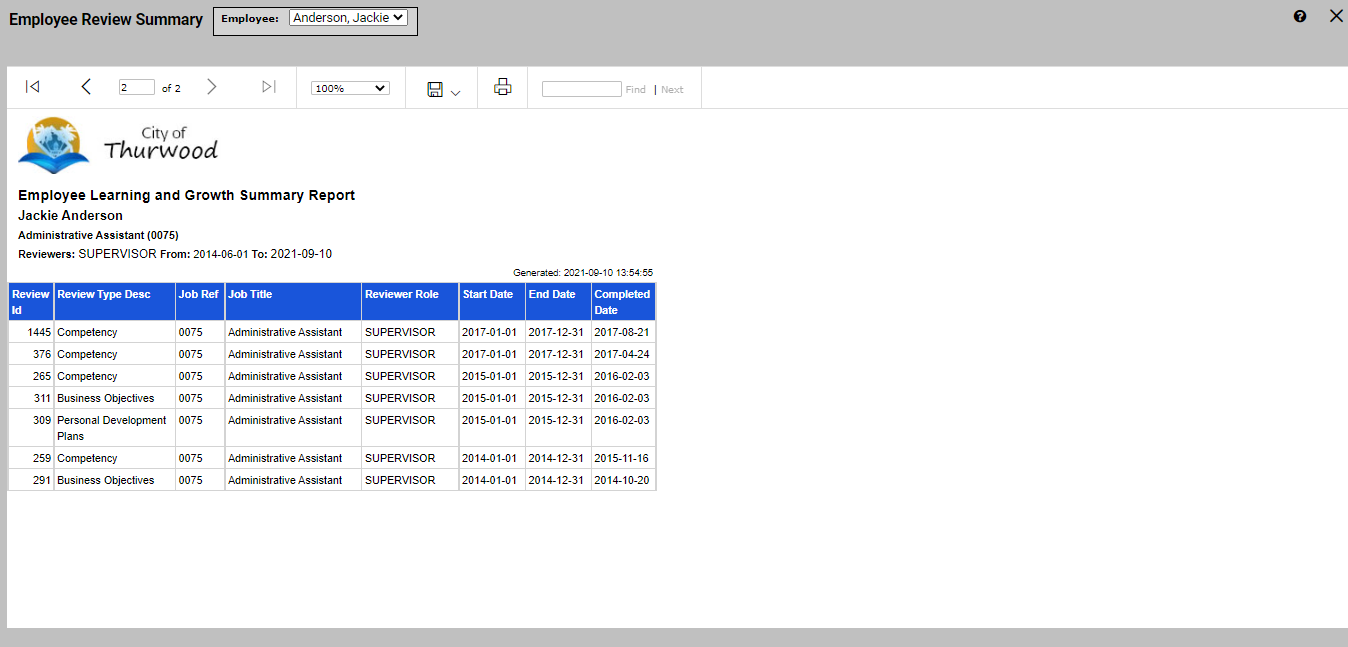
As a reference, the second page of the report, lists the reviews from were the data is obtained for the dashboard report. The Employee Learning and Growth Review is the process and/or printed report of the evaluation of Employee learning and growth for a given period. It can be completed by one or more people in varying Reviewer Roles to provide 360° feedback to the Employee.
*No reviews were completed for Jackie after the year 2017; therefore, none show in the report above.
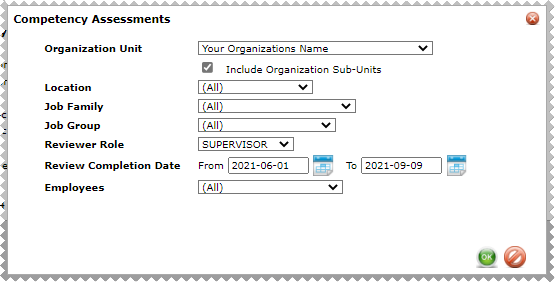
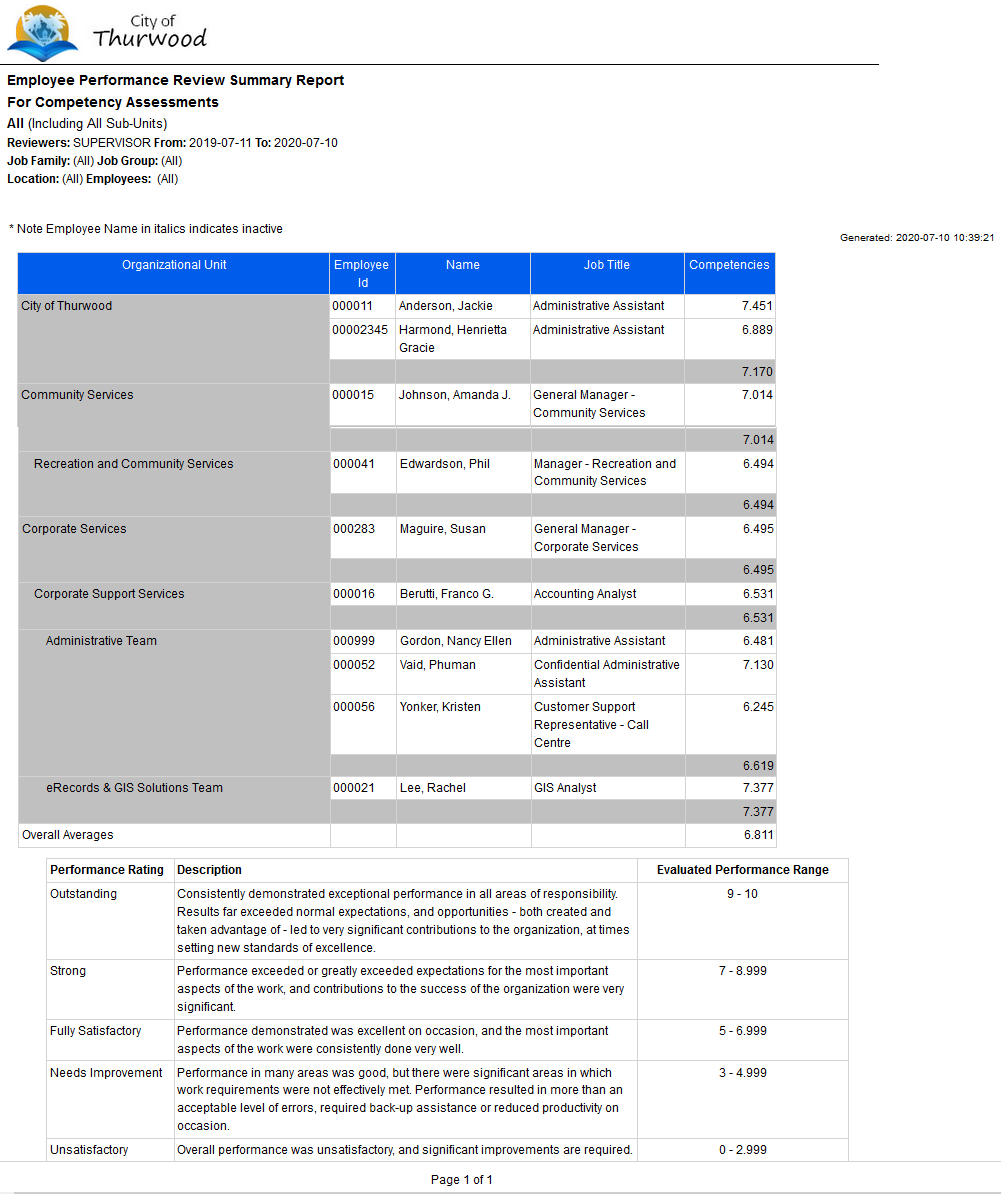
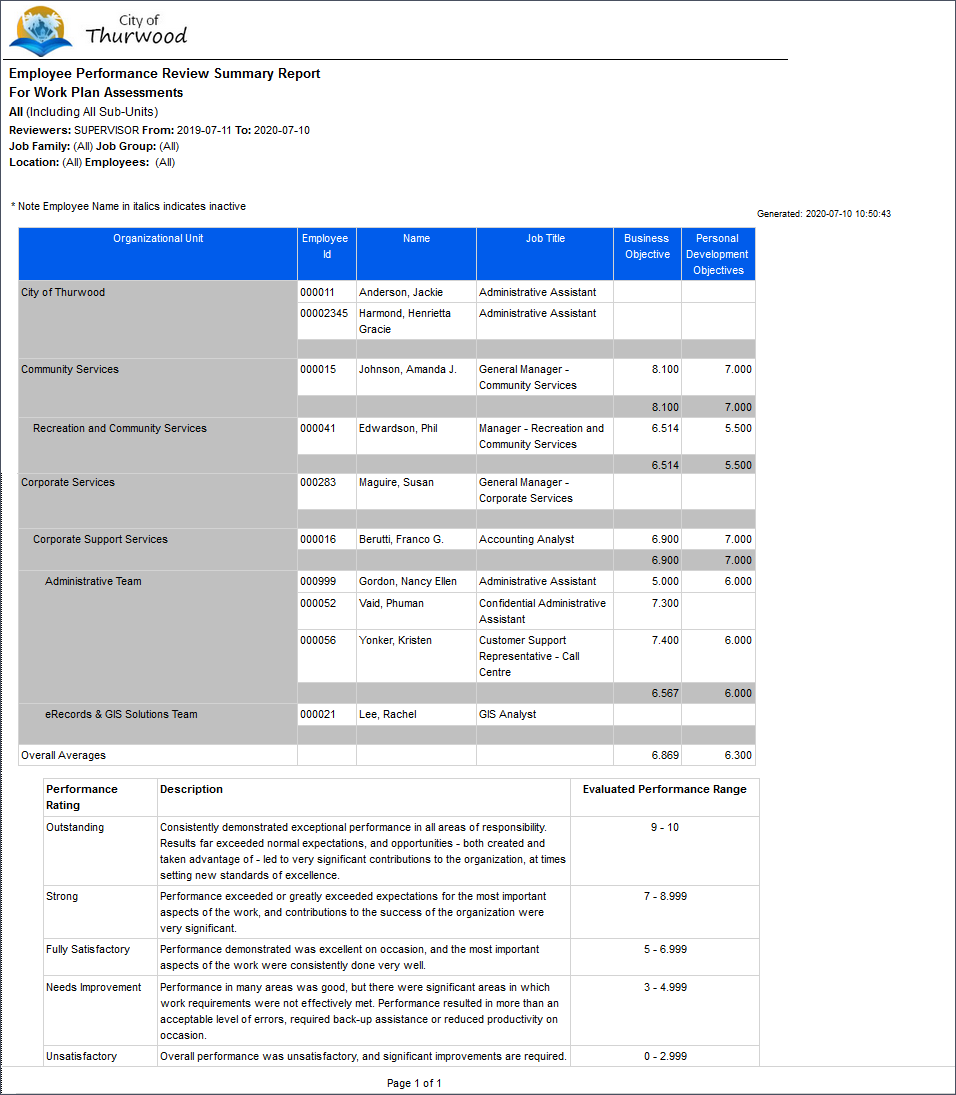
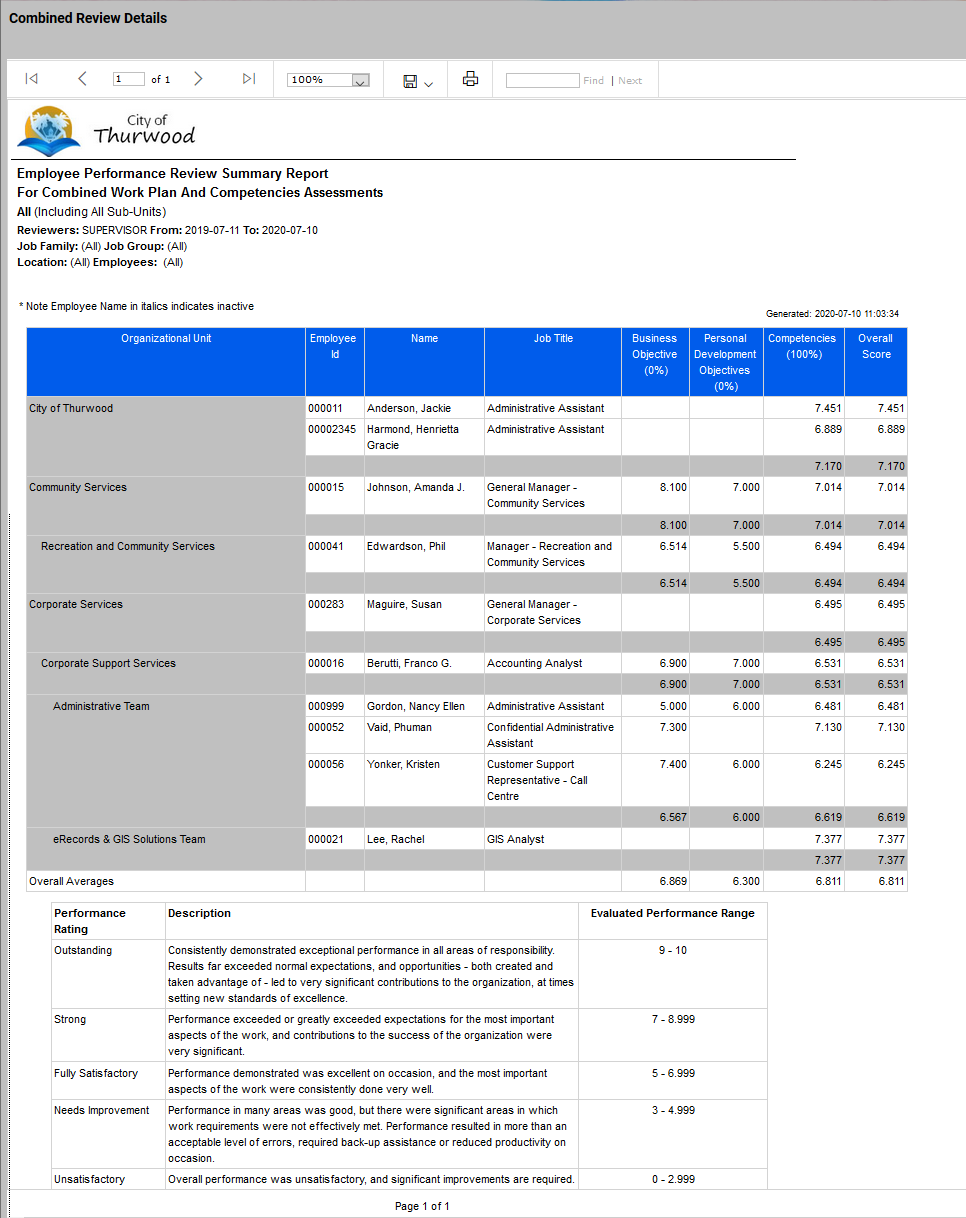
Employee Learning and Growth Review Summary Reports The Employee Learning and Growth Review Summary Reports gives a listing of the overall Learning and Growth Evaluation, as calculated in the Learning and Growth Report, for each of the selected Employees. There are three views for generating this report: •Work Plan Assessments •Competency Assessments •Combined Work Plan and Competency Assessments
Understanding the Learning and Growth Review Summary Reports Refer to the following for details about what is being shown on the Learning and Growth Evaluation Summary Reports.
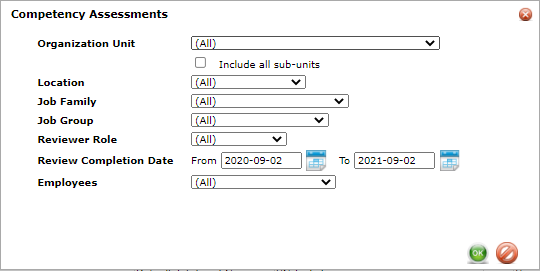
The available parameters are the same for all three reports: •Group by Organization Unit •Group by Location •Group by Job Family •Group by Job Group •Reviewer Role •Review Completion Dates •Employees
Ex.
Generated Report for Competency Assessments:
Combined Work Plan and Competency
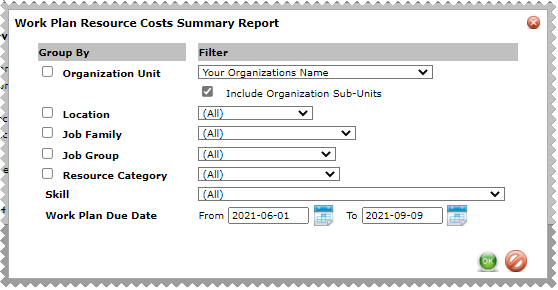
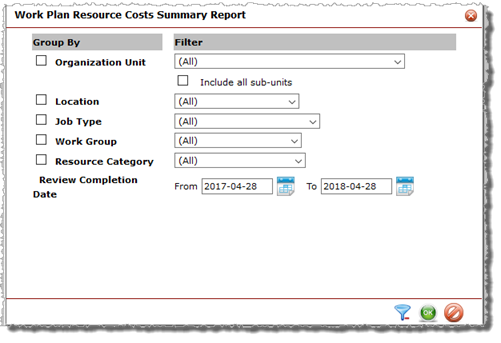
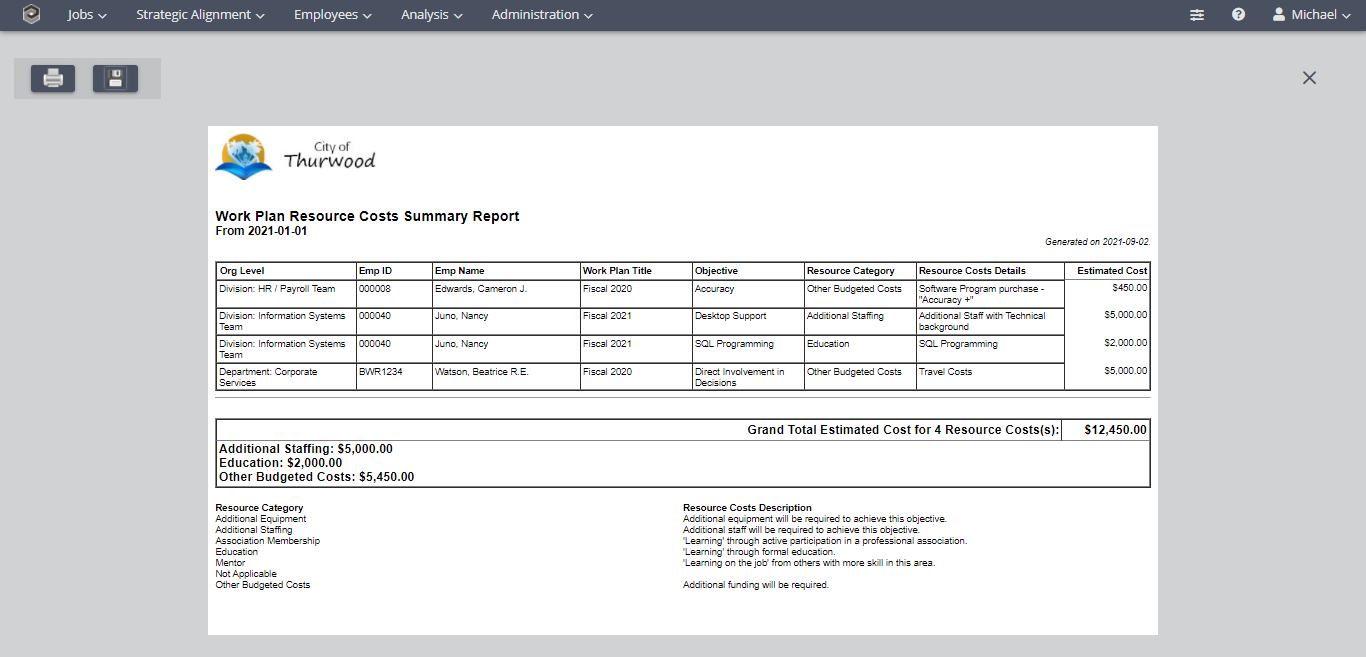
Work Plan Resource Summary Report The Work Plan Resource Summary summarizes Resource information for the Work Plans of the selected Employees.
Note: This menu option will not appear if the Objective Field Configuration for Resources is not enabled.
Available Parameters: •Select All Resources •Group by Organization Unit •Group by Location •Group by Job Family •Group by Job Group •Group by Resource Category •Review Dates
Generated Report:
|