|

Learning and Growth Reports and Dashboard Reporting
Version 2025
Learning and Growth Reports and Dashboard Graphics
Graphical and analytical reports are available in Encompassing Visions that effectively communicate and track learning and growth details at an individual contributor, team and organization-wide level. Reporting on job–specific behavioural and technical skills demonstrated, business objectives accomplished, and professional development goals achieved, the software provides both detailed and summarized information about who is doing what, how well, at what cost, and to what benefit.
Many of these aggregate reports are found in the Administration module, and specifically in the Administration Reports area.
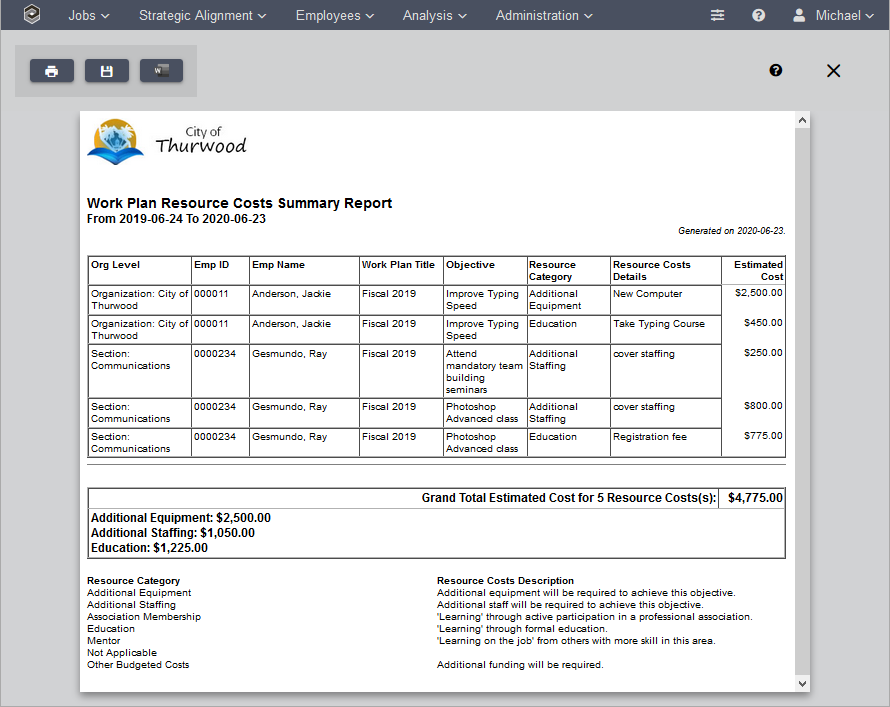
Under the sub-heading ‘Employee Related’, much of this detailed information about people and team learning and growth is available for analytical comparisons over time. This is also (under the sub-heading ‘Organization Related’) where information about the financial costs ($’s) related to specific business objectives can be tracked for organizational budgeting purposes.
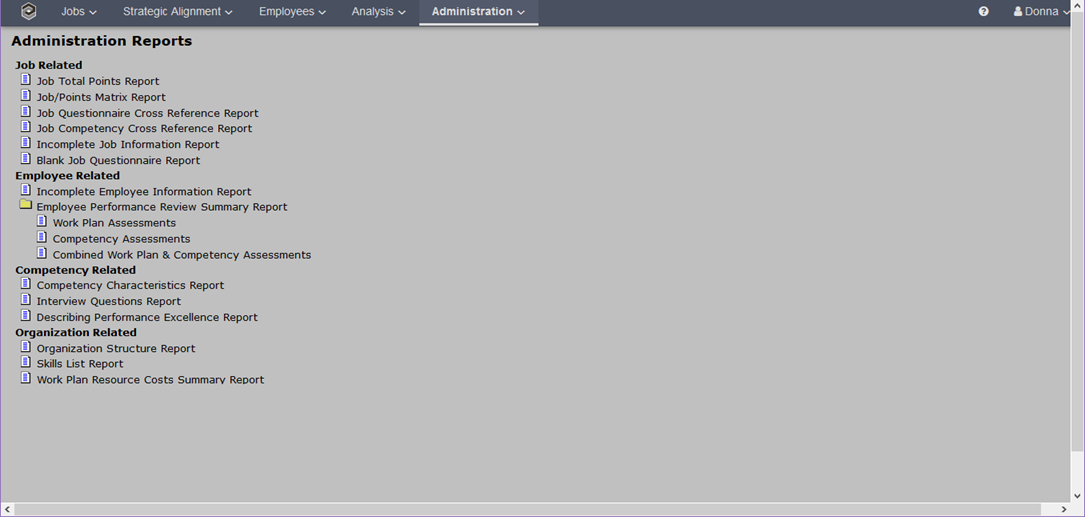
From the Main Menu move the mouse over Administration located in the navigation bar. Go to Reports and click the Print Reports function:
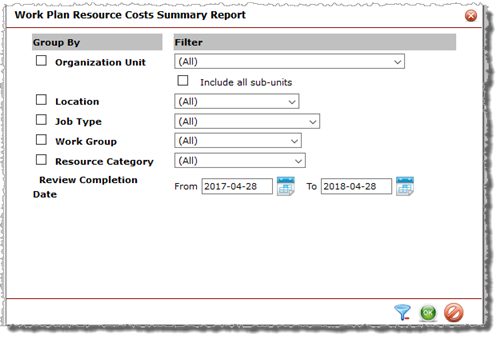
Work Plan Resource Summary Report
Organizational Learning and Growth:
In ‘Analysis’ found on the main System Menu, the Organizational Learning and Growth module enables team leaders, management and executive staff to review detailed reports about their organizational units learning and growth vis-à-vis the organization as a whole, for any particular period of time. With information presented in both report detail and graphical display formats, every person responsible for managing others can know whether the learning and growth of their team is improving over time, what specifically is changing, who is contributing to that change, what staff assignment/training investment decisions seem to be making the difference, whether the change is consistent with organizational values, and if consistently demonstrating improved organizational values is achieving greater organizational success.
For Dashboard Reporting:
This screen is found in Analysis. Click on Organizational Learning and Growth function.
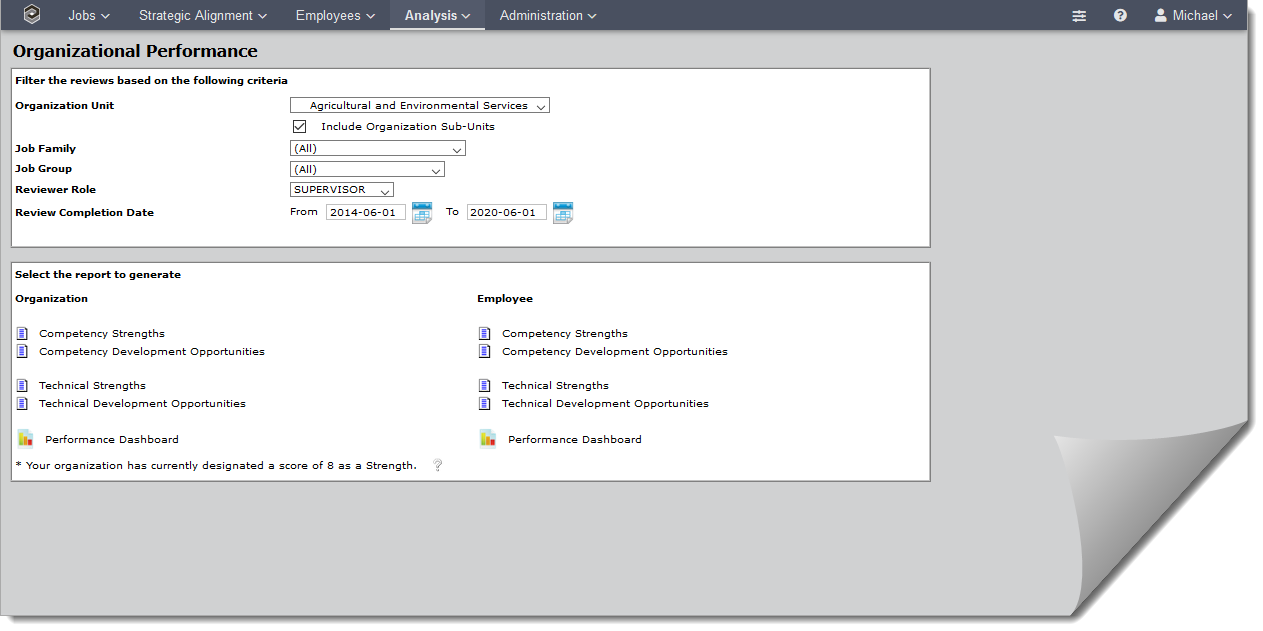
(A Competency and Technical Skill ‘Strength’ is determined by the Policy: Employees > Employee Settings > Reviews > What constitutes a strength in your organization?)
In the following report example, the learning and growth of the Organization Unit - Agricultural and Environmental Services (along with the sub units) is based on the Reviews completed between June 1/2014 – June 1/2020
Note: This organization has designated their Strength to be 8
Frequency: this is the number of Employees who have this competency or skill evaluated as a strength or development opportunity.
Gap: The difference between the employee's learning and growth rating and the maximum possible evaluation result they could have received for the competency. It is based on completed, averaged reviews during the selected review period, and the relative importance of each Competency in the Employee's Job (which in turn is a product of the Job Evaluation process that determined what the job is paid to do.)
By clicking on the screen option “Learning and Growth Dashboard” at the bottom of the ‘Organization’ filters, this is what the system generates…
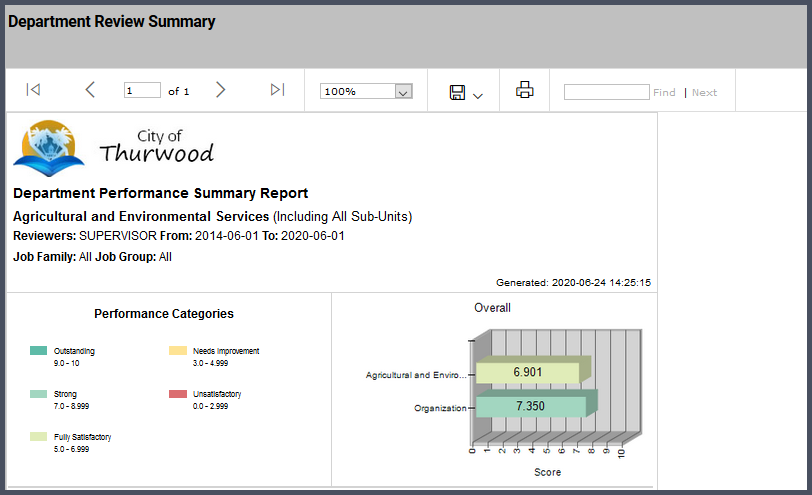
The Organizational report compares the selected Unit’s results with the Organization's results.
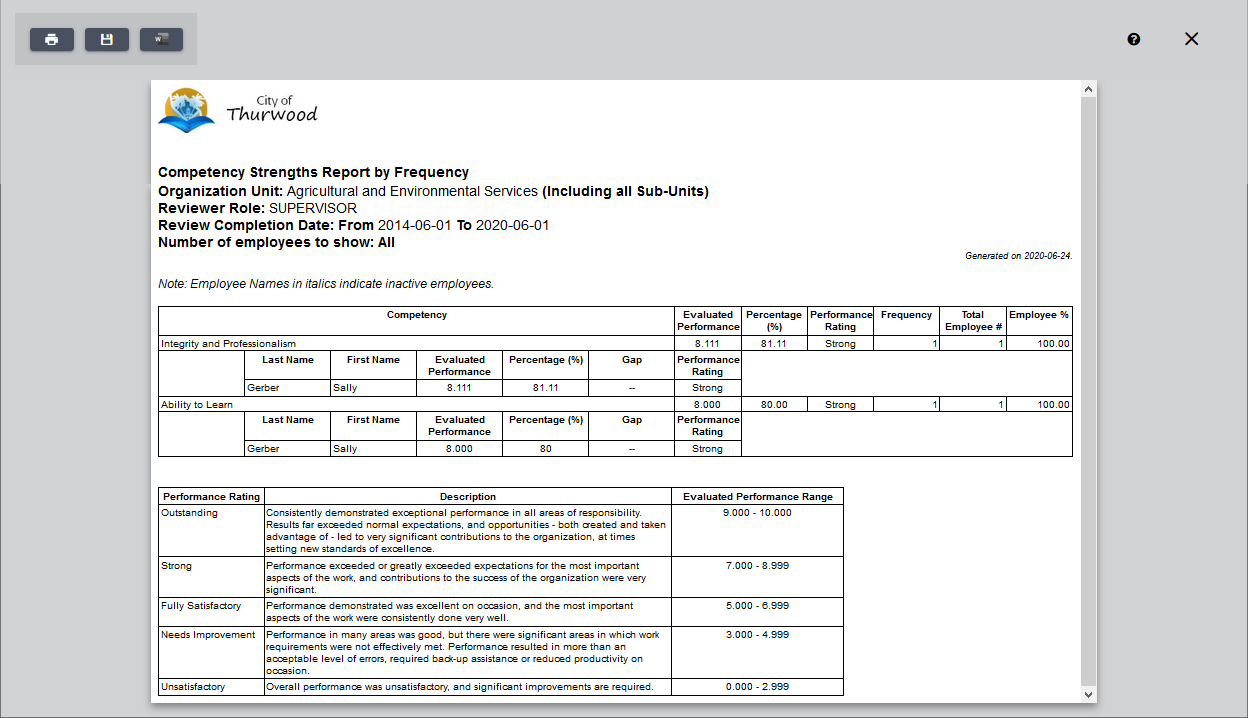
In this particular example, the report lists 'Integrity and Professionalism' as an organizational Strength for Agricultural and Environmental Services and its related sub-units. There is 1 employee who demonstrates 'Integrity and Professionalism' particularly well within the organizational area, and the detailed report available within this module tells you who the individual is. If you will, this employee could be considered a potential mentor to others needing development with 'Integrity and Professionalism'.
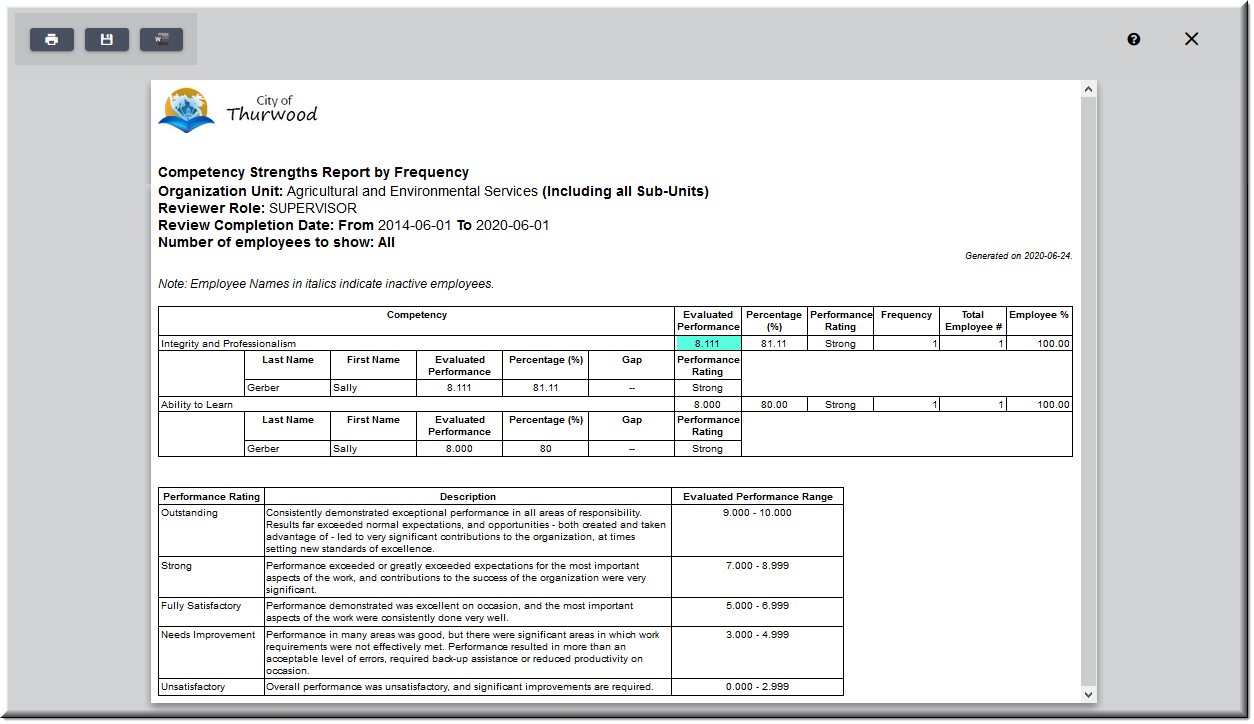
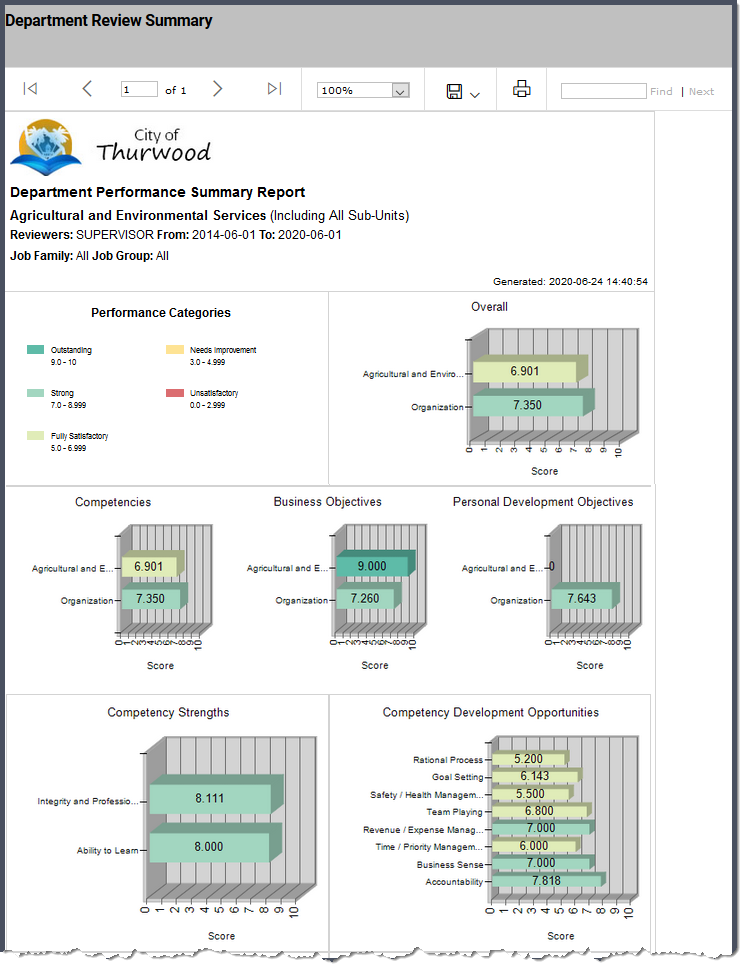
Contained in the same Dashboard Report is detailed information about Competency Development Opportunities for staff within the department. This report summarizes the behavioural competencies demonstrated at less than desirable levels of learning and growth, and presents the information based on priority for development need.
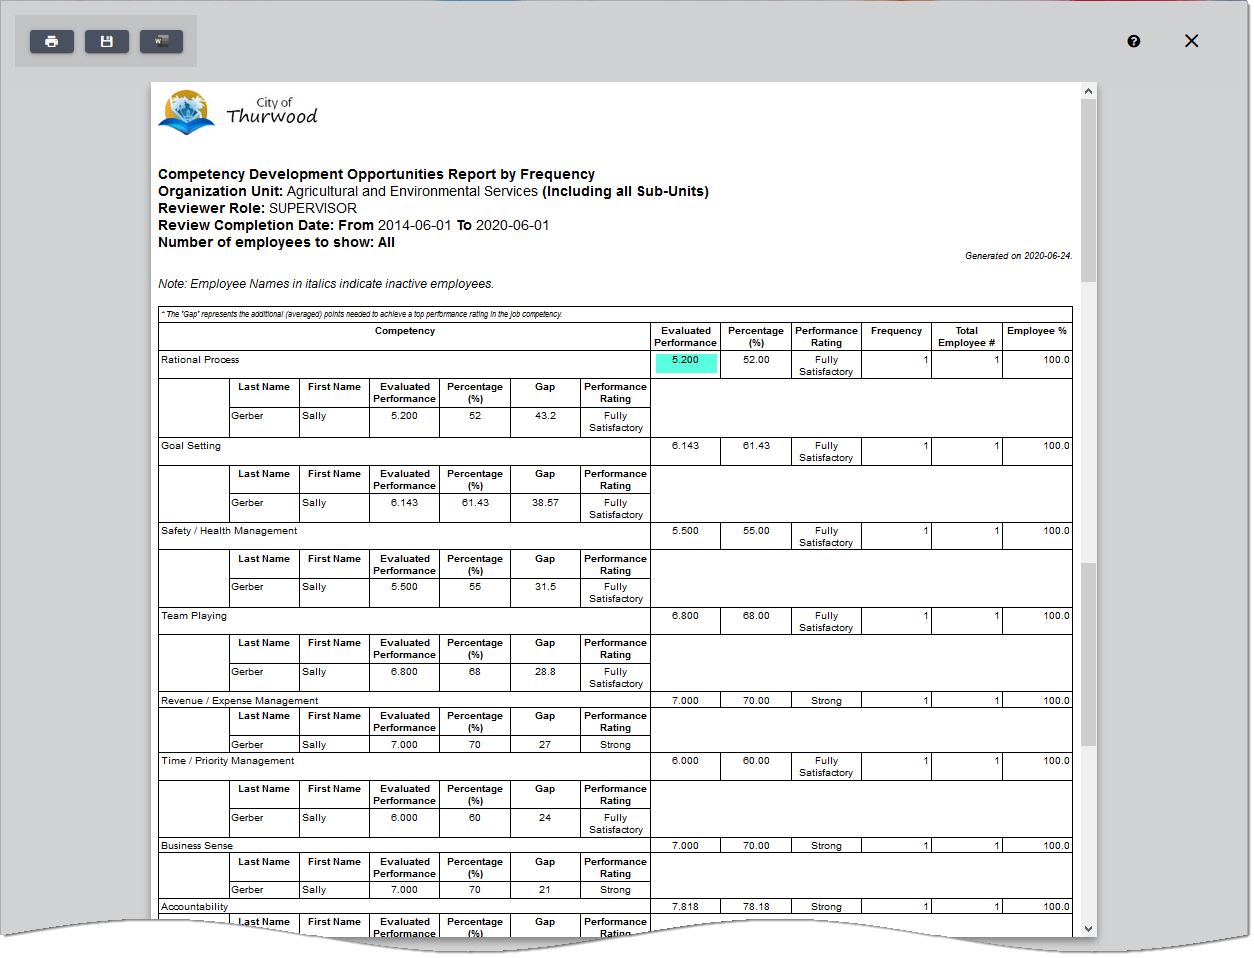
This report provides a very unique insight into an organization, and helps ensure staff training/development investments are as effective as possible. ‘Unique’ because identified Development Opportunities (or gaps) are based on 3 measures within Encompassing Visions – 1) the learning and growth review (single or multi-rated), 2) the job- specific importance of each competency in each job, and 3) the fact that the job-specific importance of each competency in each job is determined through the job evaluation process that determined what the job is worth, and why. That’s what enables Encompassing Visions to so significantly eliminate bias and subjectivity in the identification of training needs, while at the same time enable organizations to more objectively quantify the effectiveness of their training investments.
As noted in the sample report below, 1 employee needs to develop their Rational Process skills to make it a personal ‘Strength’. Based upon this report, the organization can see at a glance who that person is.
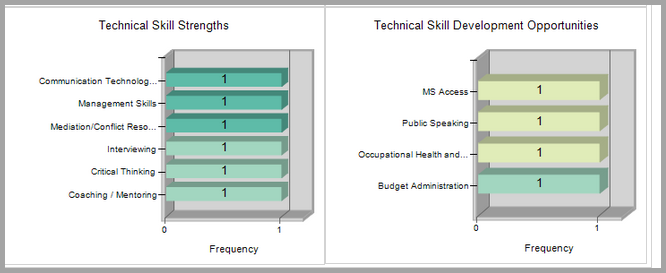
The Technical Skill Strengths Report itemizes the particular Technical Skills whose Strengths occur the most often in the selected Organizational Unit or for the selected Employees. As indicated in the above dashboard and report below, the top technical strength for the Agricultural and Environmental Services organizational unit is ‘Grounds Equipment. One out of the two employees exhibits this skill as a Strength. 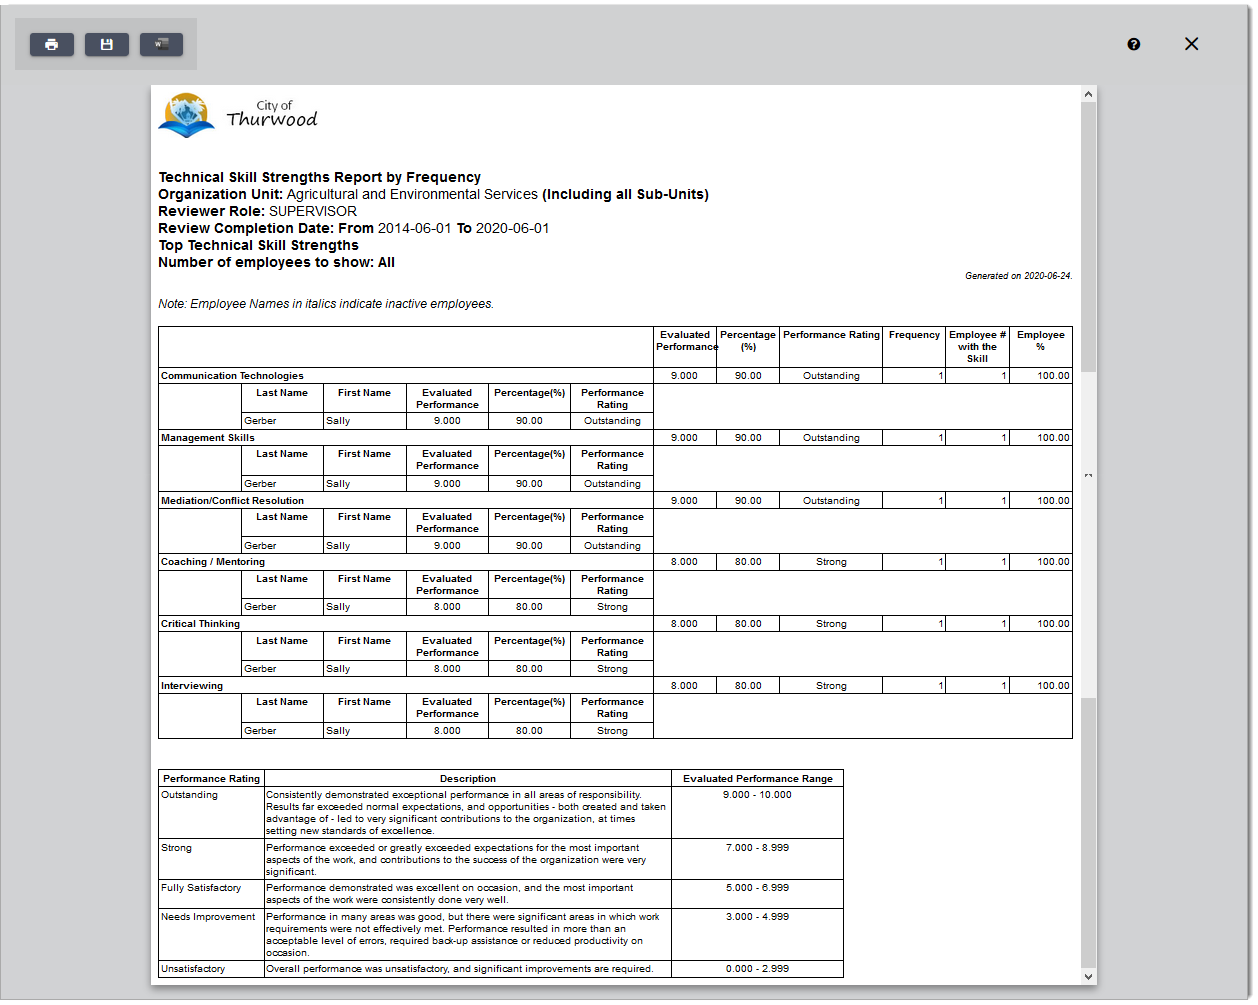
The employee's evaluated learning and growth is equal to or above the definition of strength for the organization.
The Technical Development Opportunities report shows those Technical Skills that exhibit the largest and most frequent gaps in the selected Organization Unit or for the selected Employee.
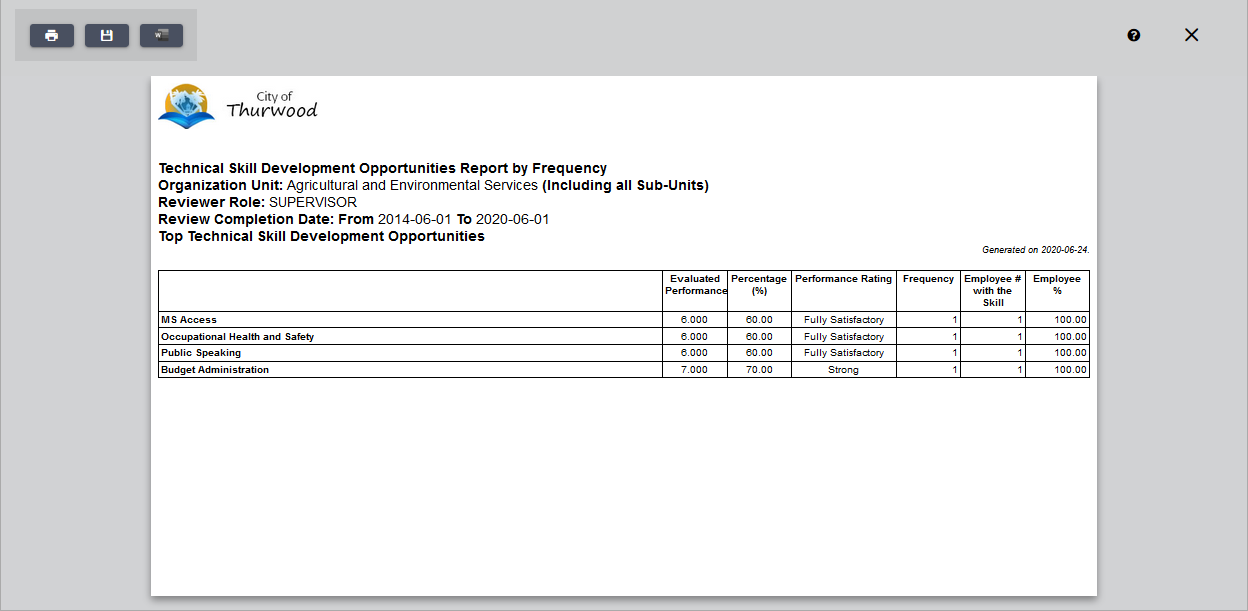
As noted above in the dashboard report, MS Access is a technical skill that is a weakness for the organizational unit. Employees who show the greatest development opportunity are listed. These will be employees whose evaluated learning and growth rating is less than the definition of strength for the organization.
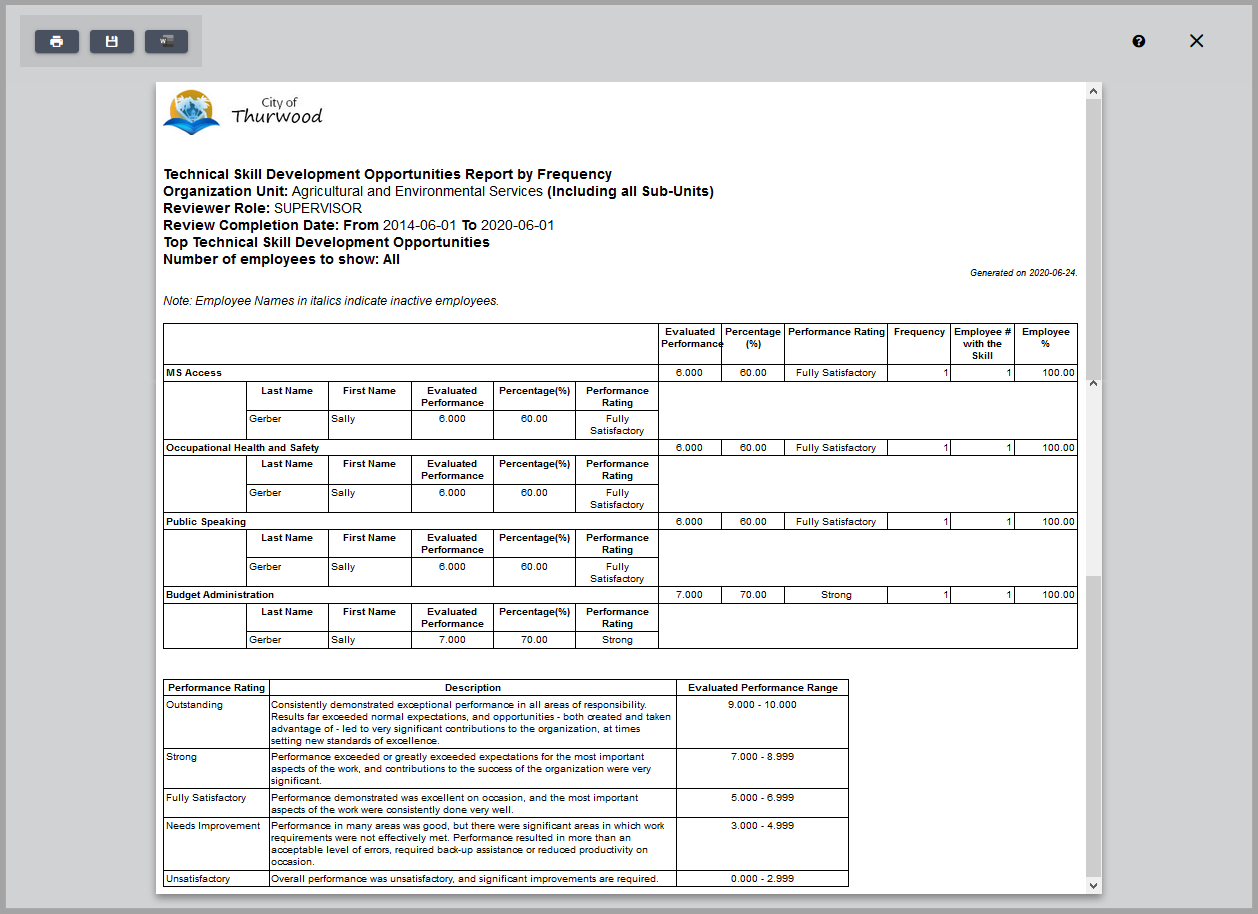
As mentioned earlier, Encompassing Visions calculates the difference between job-specific expectations and employee-specific observations to early-identify potential mentors, effectively develop training plans, and over time quantify the impact of all training investments. And because technical and behavioural competencies are job specific, always based on what the incumbent is paid to do, and specifically tied to organizational goals and values, improving employee learning and growth as measured in Encompassing Visions will consistently and positively correlate with measures of organizational success.
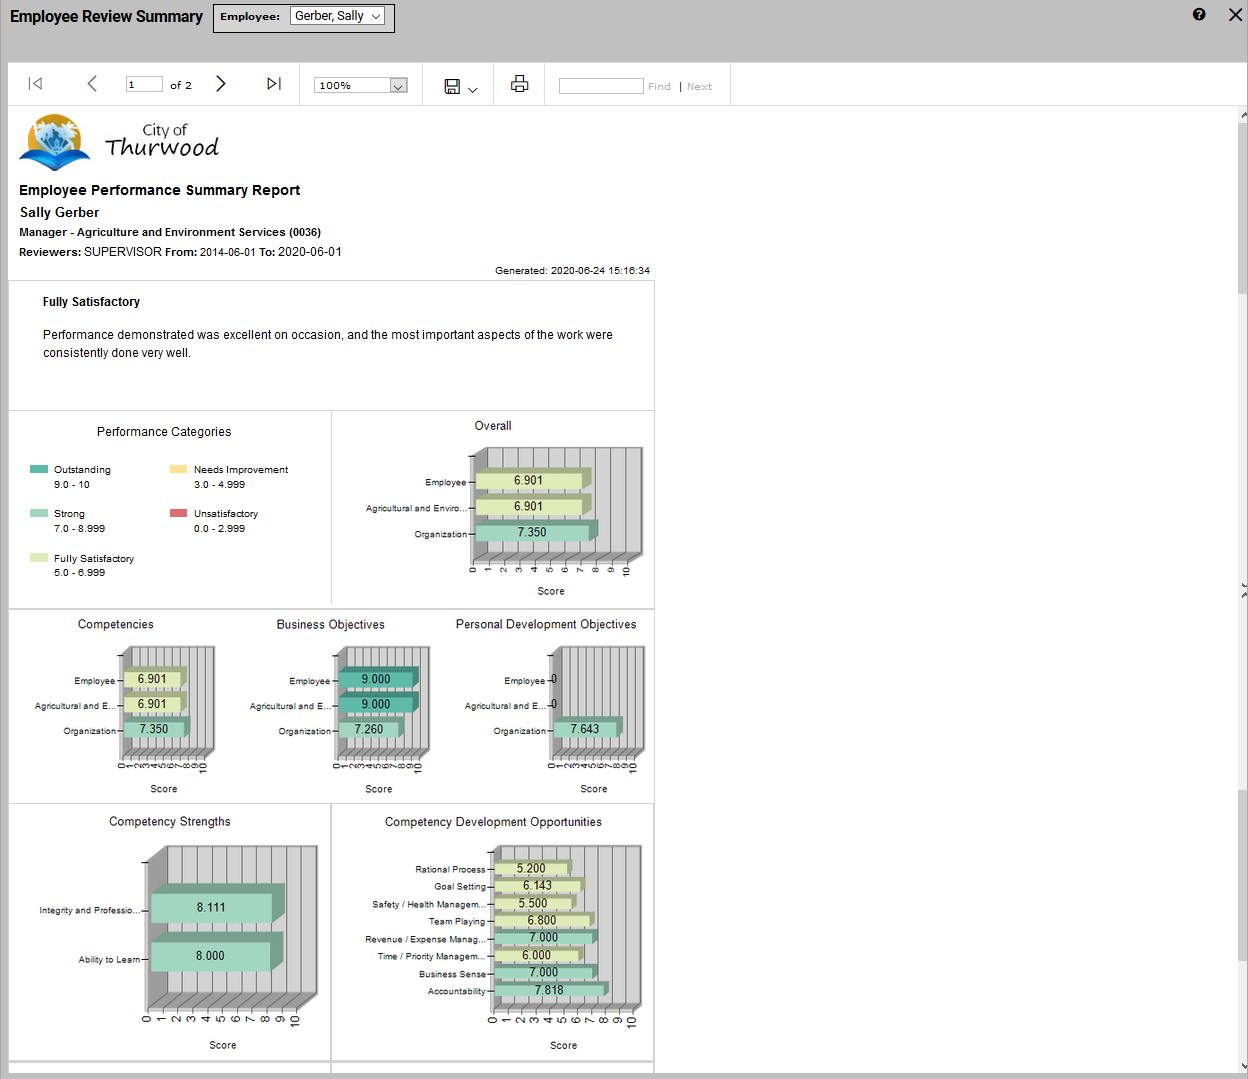
Encompassing Visions generates a dashboard report that summarizes the technical skills and behavioural competencies identified in the review period as either a strength or development need for each employee.
.
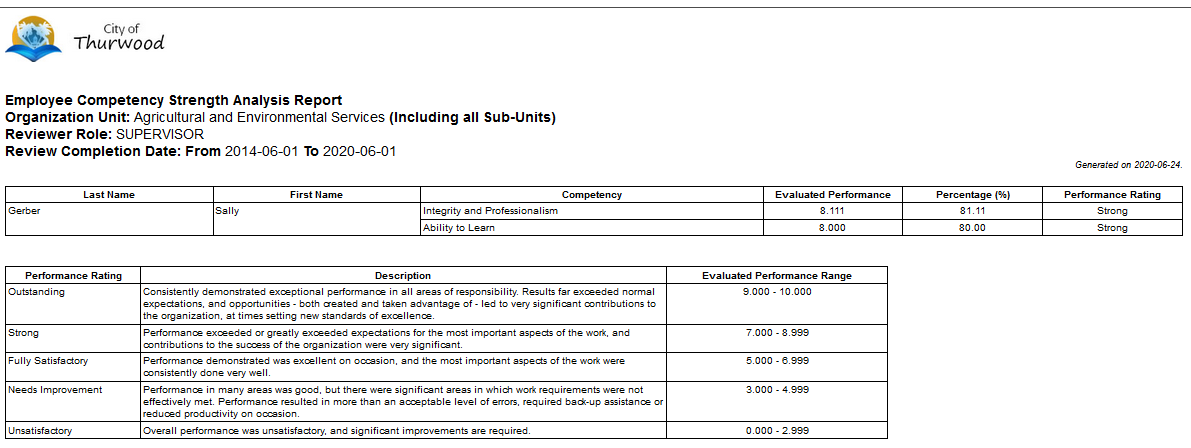
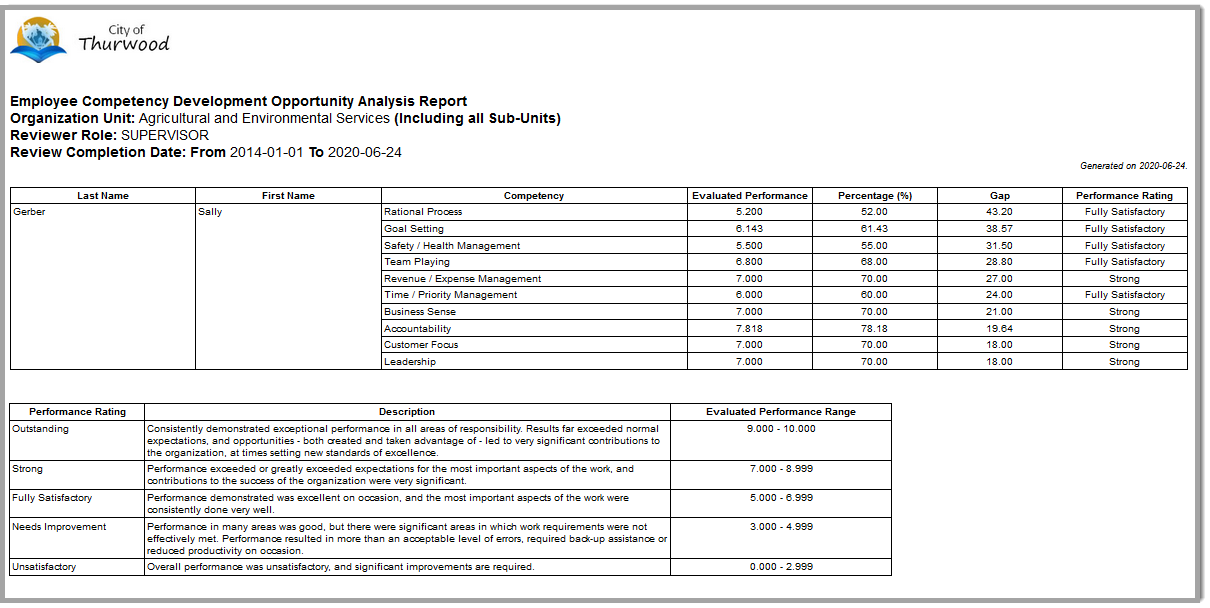
In our example, the Employee Competency Strength Analysis Report indicates that Sally Gerber exhibits Integrity and Professionalism and the Ability to Learn as personal strengths. The Employee Competency Development Opportunity Analysis Report shows the Competencies where she fell (just) short
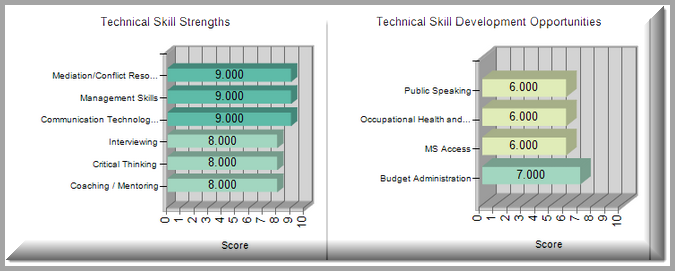
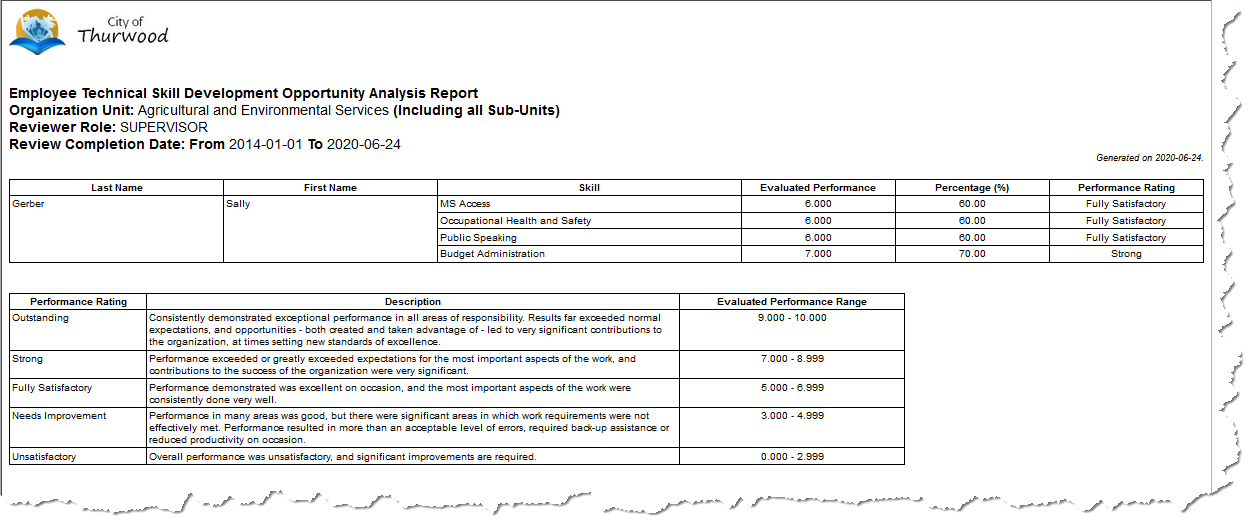
At a glance, the ‘Dashboard’ and ‘Analysis’ reports display her personal development priorities as they relate to the technical skills she needs in her job.
| 


